
25 days ago when I first stepped aboard the RRS James Cook, the third and final leg looked like a long way to go, but here we are airguns firing on survey line 3. With just under 2 weeks to go, I’m a little reflective on my time so far as we sail our final seismic line. This is the longest I’ve ever been abroad for, and I’ve learned an awful lot (both science and Trivial Pursuit knowledge). I turned another year older last week (boat birthdays with night shifts are weird) and my tan isn’t as good as I’d hoped it would be by now. I’m excited for what survey line three has to offer as we venture further south to another fracture zone and conduct some of our first sea floor dredging.
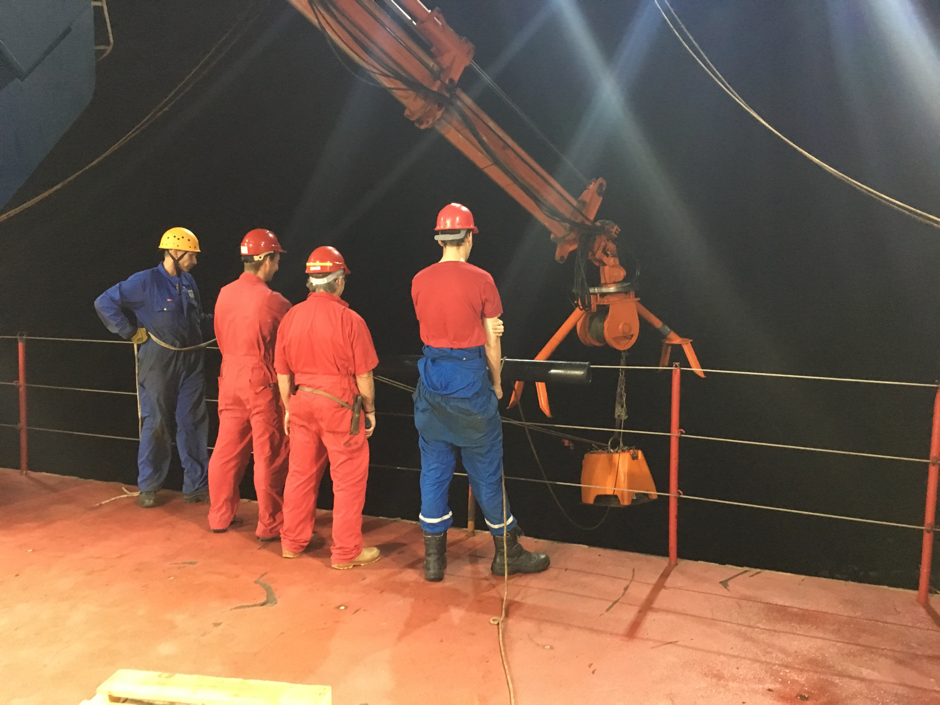
The last week or so hasn’t been without its troubles though. During survey line 1 we lost pressure in one of the airguns midway through firing, but we carried on regardless. Just before 1am on Thursday night, however, a burst pipe and a cooling system failure caused all the gas compressors to stop. Duty engineer that evening, Gavin, was quickly alerted and within minutes had located the problem and was working with technicians Stephan, Will and Ben to map out a plan for the next few hours. Also in the main lab for this early morning meeting was Captain, John, and PSO Jenny as they calmly took charge of the situation and decided to complete a gentle loop back to where we lost pressure and resume firing after a marine mammal watch at first light. It delayed us around 10 hours, but that’s what contingency days are for. All the team members involved that night worked calmly and efficiently, especially those who’d received a very early wakeup call (or late, depending on which way you look at it).
Why do we have 2 different types of recording instruments?
On each survey line we’ve gone up and down firing and in each case we have been recording the data with two different types of receivers – the OBS we have been deploying on the sea floor and hydrophones towed behind the ship for 3km. But what is the difference and why do we have two different measures?
When we’re firing the airguns, the compressed gas is released in bubbles which collapse. Huge pressure waves travel down through the sea and into the seabed. Pressure waves, like sound waves, can then travel through the rocks in the subsurface. When the incoming wave (the incident wave) reaches a boundary, some of the wave will be reflected back and some will carry on into the Earth but travelling at a different angle – this is refraction. Our two types of receivers look to measure the wave in these two different scenarios: reflection and refraction. A boundary is defined where there is a change in the acoustic property of the rocks. This may be due to a density change, the presence of a fluid, or anything that causes the speed of sound within a material to increase or decrease.
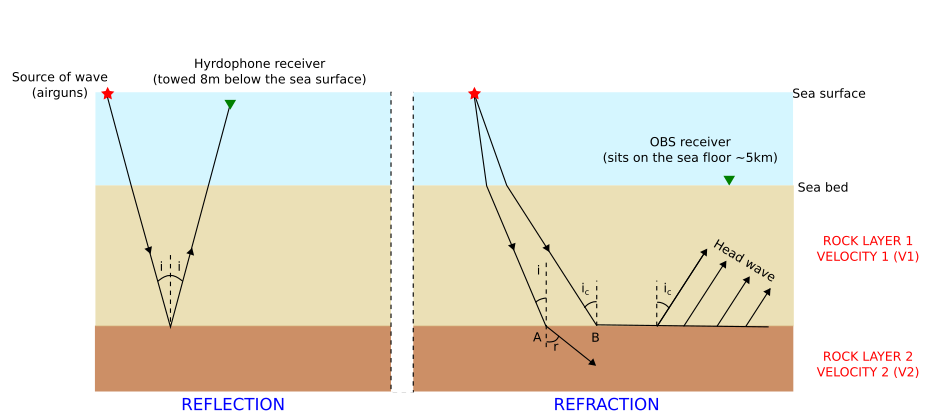
The figure shows a simple sketch of reflection and refraction. In the case of refraction, there are 2 scenarios shown, A and B showing typical and critical refraction.
Our towed streamer hydrophones are looking to detect these simple reflections. The reflection is controlled by Snell’s Law which says the wave will reflect back at the same angle at which it came in.
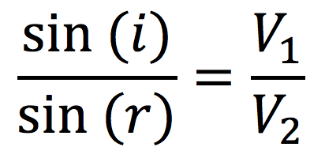
Our OBS are looking to measure how the waves refract and the figure shows 2 scenarios. In scenario A, where the speed of the wave is faster in layer 2 than layer 1 (V1 < V2) the wave will bend and deflect closer to the boundary, so the angle r is greater than the angle i. In scenario B the incoming wave hits the boundary at what is known as the ‘critical angle’, ic. At the critical angle the wave travels parallel along the boundary with a speed of V2. Some of the energy from this head wave will return to the surface, also leaving at an angle of ic. By recording the waves that arrive back at the surface and using simple equations like Snell’s law and speed = distance/time we can get an idea of what the individual layers of rock beneath the sea bed look like. The figure shows a simplified model and real geology has far more complexities but seismic techniques like this still stand as a fundamental tool in geophysics, to look at the Earth in cross section.
Why do we use both reflection and refraction data?
Although the reflection data has to ability to show us in very high resolution the shapes of rock layers and boundaries in the subsurface, reflections are highly sensitive to the velocities of the materials the waves are passing through. The arrival of refracted waves brings accurate velocity information about particular boundaries, thanks to the head wave. We can tie these in to adjust our reflection data, and make sure all the boundaries plot at the correct relative position, and they are not skewed by very high or low velocities. The OBS do record some reflection data, but they are primarily useful for this information they can provide about layer velocities.
So what are we looking for in the 3 seismic survey lines?
The first line we shot was targeted over the forebulge as described previously, and we were hoping to see something like one of the subduction sketches in previous posts. An incoming plate, being forced to bend down into the Earth and a portion of the sediments on the top, being scraped off like a snow plough to form an ‘accretionary wedge’. Survey lines 2 and 3 lie end to end and traverse 2 of these fracture zones that extend from the Mid-Atlantic. A seismic line gives us a cross section that cuts perpendicular to these fracture zones as well as the ridges which lie parallel. How were the American plates squeezed to make these ridges? We hope to understand better the structure of these ridges, as they are going to be subducted beneath the Caribbean, and have been before now. Any particularly high or low velocity zones we have may indicate the presence of a fluid or a bulk material or mineral change.
What’s up next?
This is our third time round now, deploying OBS, firing the airguns, recovering OBS so we’ve got the process well refined and very slick. It takes about a week in all, so I’ll be sure to report back next week as we do some final data collection on (dare, I say it…) our way back to dry land!